Customer Churn Prediction
Description
In this notebook/example, we’ll explore how to use PySpark to analyze and model customer churn data. The goal is to predict which customers are at risk of leaving a telecom company—so we can help businesses take action before it's too late!
We're going to:
- Load and understand the dataset
- Prepare the data for modeling
- Train a machine learning model
- Evaluate its performance
By the end, we’ll have a working churn prediction pipeline using PySpark.
Code of the Example
- Kaggle: Customer Churn Prediction
or - locally
- Download dataset
- Download the Example Notebook
- Install jupyter notebook:
pip install notebook- Run the notebook:
jupyter notebook
Jupyter Notebook
-
Install PySpark, Modules & SparkSession
!pip install pyspark# importing spark session
from pyspark.sql import SparkSession
# data visualization modules
import matplotlib.pyplot as plt
import plotly.express as px
import plotly.colors as pc
# pandas module
import pandas as pd
# pyspark SQL functions
from pyspark.sql.functions import col, when, count, udf
# pyspark data preprocessing modules
from pyspark.ml.feature import Imputer, StringIndexer, VectorAssembler, StandardScaler, OneHotEncoder
# pyspark data modeling and model evaluation modules
from pyspark.ml.classification import DecisionTreeClassifier
from pyspark.ml.evaluation import BinaryClassificationEvaluatorspark = SparkSession.builder.appName("Customer_Churn_Prediction").getOrCreate()
sparkOutput:
SparkSession - in-memory

SparkContext

Spark UI

Version
    v3.5.4
Master
    local[*]
AppName
Customer_Churn_Prediction -
Load Dataset
file_path = "[YOUR PATH]/WA_Fn-UseC_-Telco-Customer-Churn.csv"
data = spark.read.format('csv') \
    .option("inferSchema", True) \
    .option("header", True) \
    .load(file_path)
data.show(4)
Output:
+----------+------+-------------+-------+----------+------+------------+----------------+---------------+--------------+------------+----------------+-----------+-----------+---------------+--------------+----------------+--------------------+--------------+------------+-----+
|customerID|gender|SeniorCitizen|Partner|Dependents|tenure|PhoneService|   MultipleLines|InternetService|OnlineSecurity|OnlineBackup|DeviceProtection|TechSupport|StreamingTV|StreamingMovies|      Contract|PaperlessBilling|       PaymentMethod|MonthlyCharges|TotalCharges|Churn|
+----------+------+-------------+-------+----------+------+------------+----------------+---------------+--------------+------------+----------------+-----------+-----------+---------------+--------------+----------------+--------------------+--------------+------------+-----+
|7590-VHVEG|Female|            0|    Yes|        No|     1|          No|No phone service|            DSL|            No|         Yes|              No|         No|         No|             No|Month-to-month|             Yes|    Electronic check|         29.85|       29.85|   No|
|5575-GNVDE|  Male|            0|     No|        No|    34|         Yes|              No|            DSL|           Yes|          No|             Yes|         No|         No|             No|      One year|              No|        Mailed check|         56.95|      1889.5|   No|
|3668-QPYBK|  Male|            0|     No|        No|     2|         Yes|              No|            DSL|           Yes|         Yes|              No|         No|         No|             No|Month-to-month|             Yes|        Mailed check|         53.85|      108.15|  Yes|
|7795-CFOCW|  Male|            0|     No|        No|    45|          No|No phone service|            DSL|           Yes|          No|             Yes|        Yes|         No|             No|      One year|              No|Bank transfer (au...|          42.3|     1840.75|   No|
+----------+------+-------------+-------+----------+------+------------+----------------+---------------+--------------+------------+----------------+-----------+-----------+---------------+--------------+----------------+--------------------+--------------+------------+-----+
only showing top 4 rows -
Print the data schema to check out the data types
data.printSchema()Output:
root
 |-- customerID: string (nullable = true)
 |-- gender: string (nullable = true)
 |-- SeniorCitizen: integer (nullable = true)
 |-- Partner: string (nullable = true)
 |-- Dependents: string (nullable = true)
 |-- tenure: integer (nullable = true)
 |-- PhoneService: string (nullable = true)
 |-- MultipleLines: string (nullable = true)
 |-- InternetService: string (nullable = true)
 |-- OnlineSecurity: string (nullable = true)
 |-- OnlineBackup: string (nullable = true)
 |-- DeviceProtection: string (nullable = true)
 |-- TechSupport: string (nullable = true)
 |-- StreamingTV: string (nullable = true)
 |-- StreamingMovies: string (nullable = true)
 |-- Contract: string (nullable = true)
 |-- PaperlessBilling: string (nullable = true)
 |-- PaymentMethod: string (nullable = true)
 |-- MonthlyCharges: double (nullable = true)
 |-- TotalCharges: string (nullable = true)
 |-- Churn: string (nullable = true)
from pyspark.sql.functions import col
data = data.withColumn("TotalCharges", col("TotalCharges").cast("double"))
data.count()Output:
7043len(data.columns)Output:
21 -
Exploratory Data Analysis
- Distribution Analysis
- Correlation Analysis
- Univariate Analysis
- Finding Missing values
-
Define lists to store different column names with different data types
data.dtypesOutput:
[('customerID', 'string'),
 ('gender', 'string'),
 ('SeniorCitizen', 'int'),
 ('Partner', 'string'),
 ('Dependents', 'string'),
 ('tenure', 'int'),
 ('PhoneService', 'string'),
 ('MultipleLines', 'string'),
 ('InternetService', 'string'),
 ('OnlineSecurity', 'string'),
 ('OnlineBackup', 'string'),
 ('DeviceProtection', 'string'),
 ('TechSupport', 'string'),
 ('StreamingTV', 'string'),
 ('StreamingMovies', 'string'),
 ('Contract', 'string'),
 ('PaperlessBilling', 'string'),
 ('PaymentMethod', 'string'),
 ('MonthlyCharges', 'double'),
 ('TotalCharges', 'double'),
('Churn', 'string')] -
Numerical features and store them into a pandas dataframe.
numerical_col = [name for name,typ in data.dtypes if typ=="double" or typ=="int"]
categorical_col = [name for name,typ in data.dtypes if typ=="string"]
numerical_col
Output:
['SeniorCitizen', 'tenure', 'MonthlyCharges', 'TotalCharges']df = data.select(numerical_col).toPandas()
df.head()Output:
SeniorCitizen 	tenure 	MonthlyCharges 	TotalCharges
0 	0 	1 	29.85 	29.85
1 	0 	34 	56.95 	1889.50
2 	0 	2 	53.85 	108.15
3 	0 	45 	42.30 	1840.75
4 0 2 70.70 151.65 -
Create histograms to analyse the distribution of our numerical columns.
fig = plt.figure(figsize=(15,10))
ax = fig.gca()
df.hist(ax=ax, bins = 20)
Output:
array([[<Axes: title={'center': 'SeniorCitizen'}>,
    <Axes: title={'center': 'tenure'}>],
    [<Axes: title={'center': 'MonthlyCharges'}>,
    <Axes: title={'center': 'TotalCharges'}>]], dtype=object)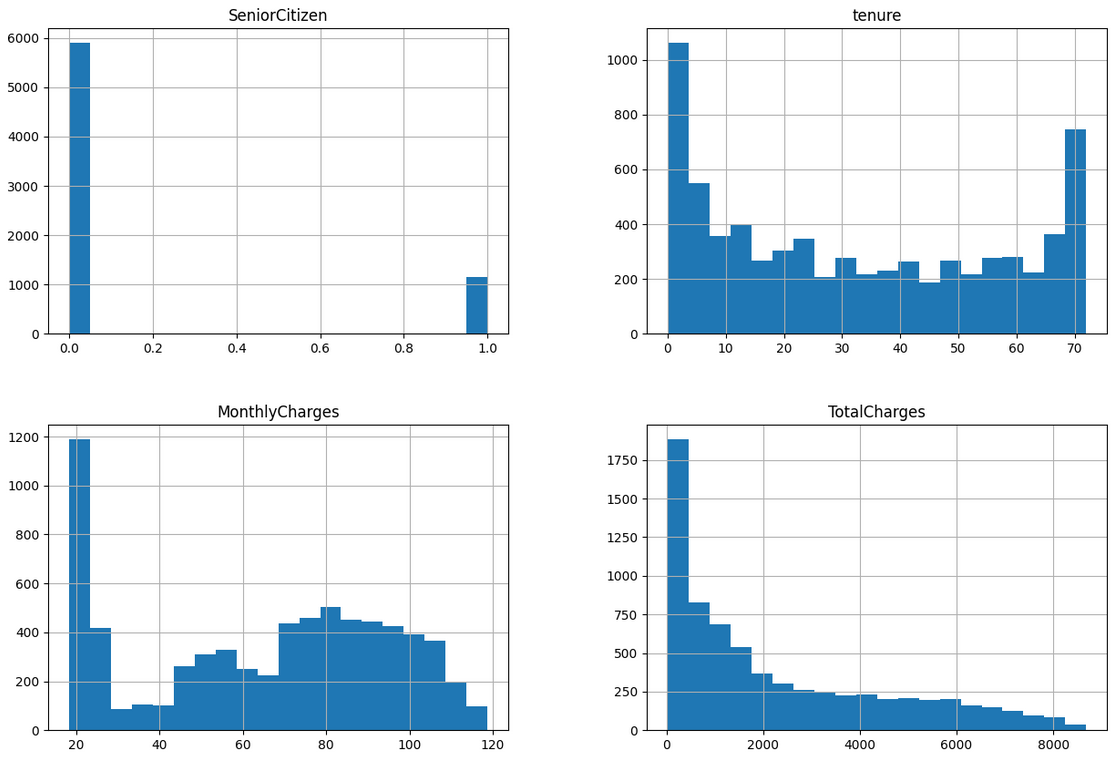
-
Generate the correlation matrix
df.corr()SeniorCitizen tenure MonthlyCharges TotalCharges
SeniorCitizen 1.000000 0.016567 0.220173 0.102411
tenure 0.016567 1.000000 0.247900 0.825880
MonthlyCharges 0.220173 0.247900 1.000000 0.651065
TotalCharges 0.102411 0.825880 0.651065 1.000000 -
Check the unique value count per each categorical variables
data.groupby("contract").count().show()data.groupby("contract").count().show()
+--------------+-----+
| contract|count|
+--------------+-----+
|Month-to-month| 3875|
| One year| 1473|
| Two year| 1695|
+--------------+-----+for coll in categorical_col:
data.groupby(coll).count().show()+----------+-----+
|customerID|count|
+----------+-----+
|3668-QPYBK| 1|
|6234-RAAPL| 1|
|1894-IGFSG| 1|
|6982-SSHFK| 1|
|5859-HZYLF| 1|
|6479-OAUSD| 1|
|2592-YKDIF| 1|
|6718-BDGHG| 1|
|3195-TQDZX| 1|
|4248-QPAVC| 1|
|5668-MEISB| 1|
|5802-ADBRC| 1|
|2712-SYWAY| 1|
|2011-TRQYE| 1|
|7244-KXYZN| 1|
|0953-LGOVU| 1|
|3623-FQBOX| 1|
|3692-JHONH| 1|
|3528-HFRIQ| 1|
|7661-CPURM| 1|
+----------+-----+
only showing top 20 rows
+------+-----+
|gender|count|
+------+-----+
|Female| 3488|
| Male| 3555|
+------+-----+
+-------+-----+
|Partner|count|
+-------+-----+
| No| 3641|
| Yes| 3402|
+-------+-----+
+----------+-----+
|Dependents|count|
+----------+-----+
| No| 4933|
| Yes| 2110|
+----------+-----+
+------------+-----+
|PhoneService|count|
+------------+-----+
| No| 682|
| Yes| 6361|
+------------+-----+
+----------------+-----+
| MultipleLines|count|
+----------------+-----+
|No phone service| 682|
| No| 3390|
| Yes| 2971|
+----------------+-----+
+---------------+-----+
|InternetService|count|
+---------------+-----+
| Fiber optic| 3096|
| No| 1526|
| DSL| 2421|
+---------------+-----+
+-------------------+-----+
| OnlineSecurity|count|
+-------------------+-----+
| No| 3498|
| Yes| 2019|
|No internet service| 1526|
+-------------------+-----+
+-------------------+-----+
| OnlineBackup|count|
+-------------------+-----+
| No| 3088|
| Yes| 2429|
|No internet service| 1526|
+-------------------+-----+
+-------------------+-----+
| DeviceProtection|count|
+-------------------+-----+
| No| 3095|
| Yes| 2422|
|No internet service| 1526|
+-------------------+-----+
+-------------------+-----+
| TechSupport|count|
+-------------------+-----+
| No| 3473|
| Yes| 2044|
|No internet service| 1526|
+-------------------+-----+
+-------------------+-----+
| StreamingTV|count|
+-------------------+-----+
| No| 2810|
| Yes| 2707|
|No internet service| 1526|
+-------------------+-----+
+-------------------+-----+
| StreamingMovies|count|
+-------------------+-----+
| No| 2785|
| Yes| 2732|
|No internet service| 1526|
+-------------------+-----+
+--------------+-----+
| Contract|count|
+--------------+-----+
|Month-to-month| 3875|
| One year| 1473|
| Two year| 1695|
+--------------+-----+
+----------------+-----+
|PaperlessBilling|count|
+----------------+-----+
| No| 2872|
| Yes| 4171|
+----------------+-----+
+--------------------+-----+
| PaymentMethod|count|
+--------------------+-----+
|Credit card (auto...| 1522|
| Mailed check| 1612|
|Bank transfer (au...| 1544|
| Electronic check| 2365|
+--------------------+-----+
+-----+-----+
|Churn|count|
+-----+-----+
| No| 5174|
| Yes| 1869|
+-----+-----+ -
Find number of null values in all of our dataframe columns
for coll in data.columns:
    data.select(count(when(col(coll).isNull(), coll)).alias(coll)).show()
+----------+
|customerID|
+----------+
| 0|
+----------+
+------+
|gender|
+------+
| 0|
+------+
+-------------+
|SeniorCitizen|
+-------------+
| 0|
+-------------+
+-------+
|Partner|
+-------+
| 0|
+-------+
+----------+
|Dependents|
+----------+
| 0|
+----------+
+------+
|tenure|
+------+
| 0|
+------+
+------------+
|PhoneService|
+------------+
| 0|
+------------+
+-------------+
|MultipleLines|
+-------------+
| 0|
+-------------+
+---------------+
|InternetService|
+---------------+
| 0|
+---------------+
+--------------+
|OnlineSecurity|
+--------------+
| 0|
+--------------+
+------------+
|OnlineBackup|
+------------+
| 0|
+------------+
+----------------+
|DeviceProtection|
+----------------+
| 0|
+----------------+
+-----------+
|TechSupport|
+-----------+
| 0|
+-----------+
+-----------+
|StreamingTV|
+-----------+
| 0|
+-----------+
+---------------+
|StreamingMovies|
+---------------+
| 0|
+---------------+
+--------+
|Contract|
+--------+
| 0|
+--------+
+----------------+
|PaperlessBilling|
+----------------+
| 0|
+----------------+
+-------------+
|PaymentMethod|
+-------------+
| 0|
+-------------+
+--------------+
|MonthlyCharges|
+--------------+
| 0|
+--------------+
+------------+
|TotalCharges|
+------------+
| 11|
+------------+
+-----+
|Churn|
+-----+
| 0|
+-----+ -
Data Preprocessing
-
Handling the missing values
-
Removing the outliers if they exist.
-
Handling the missing values
- Create a list of column names with missing values
col_with_missing_val = ["TotalCharges"]- Creating our Imputer
imputer = Imputer(inputCols=col_with_missing_val, outputCols=col_with_missing_val).setStrategy("mean")- Use Imputer to fill the missing values
imputer_model = imputer.fit(data)
data = imputer_model.transform(data) -
Removing the outliers
We should look at the histograms carefully to find any specific outlier out of the normal range. In this case we do not have any.
-
Feature Preparation
1- Numerical Features:
1-1 Vector Assembling
1-2 Numerical Scaling
2- Categorical Features:
2-1 String Indexing
2-2 Vector Assembling
3- Combining the numerical and categorical feature vectors
-
Vector Assembling
To apply our machine learning model we need to combine all of our numerical and categorical features into vectors. For now let's create a feature vector for our numerical columns.
numerical_vector_assembler = VectorAssembler(inputCols= numerical_col, outputCol= "numerical_features_vector")
data = numerical_vector_assembler.transform(data)
data.show(1)
Output:
+----------+------+-------------+-------+----------+------+------------+----------------+---------------+--------------+------------+----------------+-----------+-----------+---------------+--------------+----------------+----------------+--------------+------------+-----+-------------------------+
|customerID|gender|SeniorCitizen|Partner|Dependents|tenure|PhoneService|   MultipleLines|InternetService|OnlineSecurity|OnlineBackup|DeviceProtection|TechSupport|StreamingTV|StreamingMovies|      Contract|PaperlessBilling|   PaymentMethod|MonthlyCharges|TotalCharges|Churn|numerical_features_vector|
+----------+------+-------------+-------+----------+------+------------+----------------+---------------+--------------+------------+----------------+-----------+-----------+---------------+--------------+----------------+----------------+--------------+------------+-----+-------------------------+
|7590-VHVEG|Female|            0|    Yes|        No|     1|          No|No phone service|            DSL|            No|         Yes|              No|         No|         No|             No|Month-to-month|             Yes|Electronic check|         29.85|       29.85|   No|     [0.0,1.0,29.85,29...|
+----------+------+-------------+-------+----------+------+------------+----------------+---------------+--------------+------------+----------------+-----------+-----------+---------------+--------------+----------------+----------------+--------------+------------+-----+-------------------------+
only showing top 1 row -
Numerical Scaling
Standardize all of our numerical features.
scaler = StandardScaler(inputCol="numerical_features_vector",
                        outputCol= "numerical_features_scaled", withStd = True, withMean=True)
data = scaler.fit(data).transform(data)
data.show(1)
Output:
+----------+------+-------------+-------+----------+------+------------+----------------+---------------+--------------+------------+----------------+-----------+-----------+---------------+--------------+----------------+----------------+--------------+------------+-----+-------------------------+-------------------------+
|customerID|gender|SeniorCitizen|Partner|Dependents|tenure|PhoneService|   MultipleLines|InternetService|OnlineSecurity|OnlineBackup|DeviceProtection|TechSupport|StreamingTV|StreamingMovies|      Contract|PaperlessBilling|   PaymentMethod|MonthlyCharges|TotalCharges|Churn|numerical_features_vector|numerical_features_scaled|
+----------+------+-------------+-------+----------+------+------------+----------------+---------------+--------------+------------+----------------+-----------+-----------+---------------+--------------+----------------+----------------+--------------+------------+-----+-------------------------+-------------------------+
|7590-VHVEG|Female|            0|    Yes|        No|     1|          No|No phone service|            DSL|            No|         Yes|              No|         No|         No|             No|Month-to-month|             Yes|Electronic check|         29.85|       29.85|   No|     [0.0,1.0,29.85,29...|     [-0.4398852612617...|
+----------+------+-------------+-------+----------+------+------------+----------------+---------------+--------------+------------+----------------+-----------+-----------+---------------+--------------+----------------+----------------+--------------+------------+-----+-------------------------+-------------------------+
only showing top 1 row -
String Indexing
We need to convert all the string columns to numeric columns. To do so, first let's create a copy of each column.
categorical_col_index = [name+"_idx" for name in categorical_col]
categorical_col_index
Output:
['customerID_idx',
 'gender_idx',
 'Partner_idx',
 'Dependents_idx',
 'PhoneService_idx',
 'MultipleLines_idx',
 'InternetService_idx',
 'OnlineSecurity_idx',
 'OnlineBackup_idx',
 'DeviceProtection_idx',
 'TechSupport_idx',
 'StreamingTV_idx',
 'StreamingMovies_idx',
 'Contract_idx',
 'PaperlessBilling_idx',
 'PaymentMethod_idx',
 'Churn_idx']
indexer = StringIndexer(inputCols=categorical_col, outputCols=categorical_col_index)
data = indexer.fit(data).transform(data)
data.show(1)Output:
+----------+------+-------------+-------+----------+------+------------+----------------+---------------+--------------+------------+----------------+-----------+-----------+---------------+--------------+----------------+----------------+--------------+------------+-----+-------------------------+-------------------------+--------------+----------+-----------+--------------+----------------+-----------------+-------------------+------------------+----------------+--------------------+---------------+---------------+-------------------+------------+--------------------+-----------------+---------+
|customerID|gender|SeniorCitizen|Partner|Dependents|tenure|PhoneService|   MultipleLines|InternetService|OnlineSecurity|OnlineBackup|DeviceProtection|TechSupport|StreamingTV|StreamingMovies|      Contract|PaperlessBilling|   PaymentMethod|MonthlyCharges|TotalCharges|Churn|numerical_features_vector|numerical_features_scaled|customerID_idx|gender_idx|Partner_idx|Dependents_idx|PhoneService_idx|MultipleLines_idx|InternetService_idx|OnlineSecurity_idx|OnlineBackup_idx|DeviceProtection_idx|TechSupport_idx|StreamingTV_idx|StreamingMovies_idx|Contract_idx|PaperlessBilling_idx|PaymentMethod_idx|Churn_idx|
+----------+------+-------------+-------+----------+------+------------+----------------+---------------+--------------+------------+----------------+-----------+-----------+---------------+--------------+----------------+----------------+--------------+------------+-----+-------------------------+-------------------------+--------------+----------+-----------+--------------+----------------+-----------------+-------------------+------------------+----------------+--------------------+---------------+---------------+-------------------+------------+--------------------+-----------------+---------+
|7590-VHVEG|Female|            0|    Yes|        No|     1|          No|No phone service|            DSL|            No|         Yes|              No|         No|         No|             No|Month-to-month|             Yes|Electronic check|         29.85|       29.85|   No|     [0.0,1.0,29.85,29...|     [-0.4398852612617...|        5375.0|       1.0|        1.0|           0.0|             1.0|              2.0|                1.0|               0.0|             1.0|                 0.0|            0.0|            0.0|                0.0|         0.0|                 0.0|              0.0|      0.0|
+----------+------+-------------+-------+----------+------+------------+----------------+---------------+--------------+------------+----------------+-----------+-----------+---------------+--------------+----------------+----------------+--------------+------------+-----+-------------------------+-------------------------+--------------+----------+-----------+--------------+----------------+-----------------+-------------------+------------------+----------------+--------------------+---------------+---------------+-------------------+------------+--------------------+-----------------+---------+
only showing top 1 row -
Drop extra
customerID_idx won't add any helpful information to us; let's drop it. Churn_idx is the goal and should not be in the training process.
categorical_col_index.remove("customerID_idx")
categorical_col_index.remove("Churn_idx")
categorical_vector_assembler = VectorAssembler(inputCols=categorical_col_index, outputCol="categorical_features")
data = categorical_vector_assembler.transform(data)
data.show(1)Output:
+----------+------+-------------+-------+----------+------+------------+----------------+---------------+--------------+------------+----------------+-----------+-----------+---------------+--------------+----------------+----------------+--------------+------------+-----+-------------------------+-------------------------+--------------+----------+-----------+--------------+----------------+-----------------+-------------------+------------------+----------------+--------------------+---------------+---------------+-------------------+------------+--------------------+-----------------+---------+--------------------+
|customerID|gender|SeniorCitizen|Partner|Dependents|tenure|PhoneService|   MultipleLines|InternetService|OnlineSecurity|OnlineBackup|DeviceProtection|TechSupport|StreamingTV|StreamingMovies|      Contract|PaperlessBilling|   PaymentMethod|MonthlyCharges|TotalCharges|Churn|numerical_features_vector|numerical_features_scaled|customerID_idx|gender_idx|Partner_idx|Dependents_idx|PhoneService_idx|MultipleLines_idx|InternetService_idx|OnlineSecurity_idx|OnlineBackup_idx|DeviceProtection_idx|TechSupport_idx|StreamingTV_idx|StreamingMovies_idx|Contract_idx|PaperlessBilling_idx|PaymentMethod_idx|Churn_idx|categorical_features|
+----------+------+-------------+-------+----------+------+------------+----------------+---------------+--------------+------------+----------------+-----------+-----------+---------------+--------------+----------------+----------------+--------------+------------+-----+-------------------------+-------------------------+--------------+----------+-----------+--------------+----------------+-----------------+-------------------+------------------+----------------+--------------------+---------------+---------------+-------------------+------------+--------------------+-----------------+---------+--------------------+
|7590-VHVEG|Female|            0|    Yes|        No|     1|          No|No phone service|            DSL|            No|         Yes|              No|         No|         No|             No|Month-to-month|             Yes|Electronic check|         29.85|       29.85|   No|     [0.0,1.0,29.85,29...|     [-0.4398852612617...|        5375.0|       1.0|        1.0|           0.0|             1.0|              2.0|                1.0|               0.0|             1.0|                 0.0|            0.0|            0.0|                0.0|         0.0|                 0.0|              0.0|      0.0|(15,[0,1,3,4,5,7]...|
+----------+------+-------------+-------+----------+------+------------+----------------+---------------+--------------+------------+----------------+-----------+-----------+---------------+--------------+----------------+----------------+--------------+------------+-----+-------------------------+-------------------------+--------------+----------+-----------+--------------+----------------+-----------------+-------------------+------------------+----------------+--------------------+---------------+---------------+-------------------+------------+--------------------+-----------------+---------+--------------------+
only showing top 1 row -
Combining features
Now it is time to combine all of our categorifal features into one feature vector.
- Now let's combine categorical and numerical feature vectors.
final_vector_assembler = VectorAssembler(inputCols=["categorical_features","numerical_features_scaled"], outputCol="final_features")
data = final_vector_assembler.transform(data)

data.select(["final_features","Churn_idx"]).show()
Output:
+--------------------+---------+
|      final_features|Churn_idx|
+--------------------+---------+
|(19,[0,1,3,4,5,7,...|      0.0|
|(19,[5,6,8,12,13,...|      0.0|
|(19,[5,6,7,14,15,...|      1.0|
|[0.0,0.0,0.0,1.0,...|      0.0|
|(19,[0,15,16,17,1...|      1.0|
|(19,[0,4,8,10,11,...|      1.0|
|(19,[2,4,7,10,14,...|      0.0|
|(19,[0,3,4,5,6,13...|      0.0|
|(19,[0,1,4,8,9,10...|      1.0|
|(19,[2,5,6,7,12,1...|      0.0|
|(19,[1,2,5,6,14,1...|      0.0|
|[0.0,0.0,0.0,0.0,...|      0.0|
|[0.0,1.0,0.0,0.0,...|      0.0|
|(19,[4,7,8,10,11,...|      1.0|
|(19,[6,8,9,10,11,...|      0.0|
|[1.0,1.0,1.0,0.0,...|      0.0|
|[1.0,0.0,0.0,0.0,...|      0.0|
|[0.0,0.0,1.0,0.0,...|      0.0|
|[1.0,1.0,1.0,0.0,...|      1.0|
|(19,[0,7,8,11,15,...|      0.0|
+--------------------+---------+
only showing top 20 rows
-
-
Model Training
- Train and Test data splitting
- Creating our model
- Training our model
- Make initial predictions using our model
In this task, we are going to start training our model
train, test = data.randomSplit([0.7, 0.3], seed = 100)
print(train.count())
print(test.count())
Output:
4931
2112
Now let's create and train our desicion tree
dt = DecisionTreeClassifier(featuresCol="final_features", labelCol="Churn_idx", maxDepth=3)
model = dt.fit(train)
prediction_test = model.transform(test)
prediction_test.select(["Churn_idx", "prediction"]).show()Output:
+---------+----------+
|Churn_idx|prediction|
+---------+----------+
|      1.0|       1.0|
|      0.0|       0.0|
|      0.0|       0.0|
|      0.0|       0.0|
|      0.0|       0.0|
|      1.0|       0.0|
|      0.0|       0.0|
|      1.0|       0.0|
|      0.0|       0.0|
|      0.0|       0.0|
|      0.0|       0.0|
|      0.0|       0.0|
|      0.0|       0.0|
|      1.0|       0.0|
|      0.0|       0.0|
|      0.0|       0.0|
|      0.0|       0.0|
|      0.0|       0.0|
|      0.0|       0.0|
|      0.0|       0.0|
+---------+----------+
only showing top 20 rows -
Model Evaluation
- Calculating area under the ROC curve for the test set
- Calculating area under the ROC curve for the training set
- Hyper parameter tuning
evaluator = BinaryClassificationEvaluator(labelCol="Churn_idx")
auc_test = evaluator.evaluate(prediction_test, {evaluator.metricName: "areaUnderROC"})
auc_test
Output:
0.7617045633750168Let's get the AUC for our training set
prediction_train = model.transform(train)
evaluator = BinaryClassificationEvaluator(labelCol="Churn_idx")
auc_train = evaluator.evaluate(prediction_train, {evaluator.metricName: "areaUnderROC"})
auc_train
Output:
0.7712918493814211 -
Hyper parameter tuning
Let's find the best maxDepth parameter for our DT model.
def evaluate_dt(mode_params):
      test_accuracies = []
      train_accuracies = []

      for maxD in mode_params:
        # train the model based on the maxD
        decision_tree = DecisionTreeClassifier(featuresCol = 'final_features', labelCol = 'Churn_idx', maxDepth = maxD)
        dtModel = decision_tree.fit(train)

        # calculating test error
        predictions_test = dtModel.transform(test)
        evaluator = BinaryClassificationEvaluator(labelCol="Churn_idx")
        auc_test = evaluator.evaluate(predictions_test, {evaluator.metricName: "areaUnderROC"})
        # recording the accuracy
        test_accuracies.append(auc_test)

        # calculating training error
        predictions_training = dtModel.transform(train)
        evaluator = BinaryClassificationEvaluator(labelCol="Churn_idx")
        auc_training = evaluator.evaluate(predictions_training, {evaluator.metricName: "areaUnderROC"})
        train_accuracies.append(auc_training)

      return(test_accuracies, train_accuracies)
Let's define params list to evaluate our model iteratively with differe maxDepth parameter.
maxDepths = [2,3,4,5,6,7,8,9,10,11,12,13,14,15,16,17,18,19,20]
test_acc, train_acc = evaluate_dt(maxDepths)
print(train_acc)
print(test_acc)
Output:
[0.7789865142153861, 0.7712918493814211, 0.6826591069812441, 0.5698050008614369, 0.7097267756814049, 0.8007120163953875, 0.7888573028682286, 0.7956189539598643, 0.8211433720288286, 0.861543087146816, 0.8869290674809027, 0.9051710947878245, 0.9438019298702311, 0.9689805155962002, 0.9801039509144436, 0.9866789573385414, 0.9904768252507075, 0.9909386686251257, 0.991859001848212]
[0.7788716846464305, 0.7617045633750168, 0.6707372773945599, 0.5568304606596539, 0.6941230411597387, 0.7787209933941159, 0.754992377826191, 0.7483023871129775, 0.7435083026207427, 0.7541466377744421, 0.734785732225149, 0.7140236316591807, 0.7244768151579045, 0.7129863151316211, 0.7097137450280647, 0.7071496574402345, 0.7040645752901391, 0.7030885865978237, 0.7027474870189415]
Let's visualize our results
ddf = pd.DataFrame()
ddf["maxDepth"] = maxDepths
ddf["trainAcc"] = train_acc
ddf["testAcc"] = test_acc
ddf.head()
maxDepth trainAcc testAcc
0 2 0.778987 0.778872
1 3 0.771292 0.761705
2 4 0.682659 0.670737
3 5 0.569805 0.556830
4 6 0.709727 0.694123my_palette = pc.qualitative.Bold
px.line(ddf, x = "maxDepth", y = ["trainAcc", "testAcc"], color_discrete_sequence=my_palette)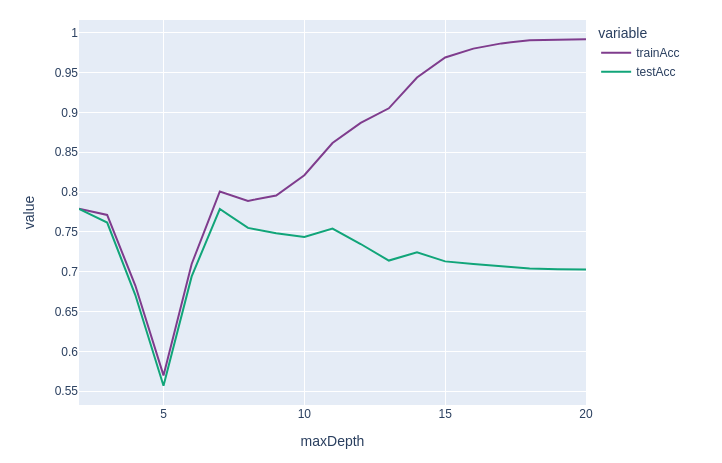
dt = DecisionTreeClassifier(featuresCol="final_features", labelCol="Churn_idx", maxDepth=7)
model = dt.fit(train) -
Recommendation
We were asked to recommend a solution to reduce the customer churn.
feature_importance = model.featureImportances
scores = [score for i, score in enumerate(feature_importance)]

ff = pd.DataFrame(scores, columns=["score"], index = categorical_col_index + numerical_col)
px.bar(ff, y = "score", color_discrete_sequence=my_palette)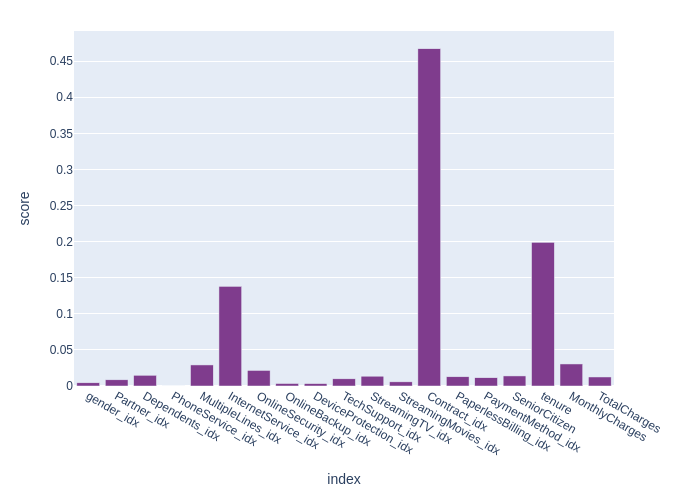
🔍 Feature Importance Interpretation This chart shows which features had the biggest impact on our model’s predictions.
📌 Contract type is by far the most important factor in predicting churn. It contributes the most to the model’s decisions.
🧓 Tenure (how long the customer has been with the company) is also a major influence. Longer tenure usually means more loyalty.
🌐 Internet service type and whether the customer is a senior citizen also played notable roles.
In short, how long a customer stays and the kind of contract they have are key drivers of churn in this dataset.
Let's go deeper and create a bar chart to visualize the customer churn per contract type.
df = data.groupby(["Contract", "Churn"]).count().toPandas()

px.bar(df, x = "Contract", y = "count", color = "Churn", color_discrete_sequence=my_palette)
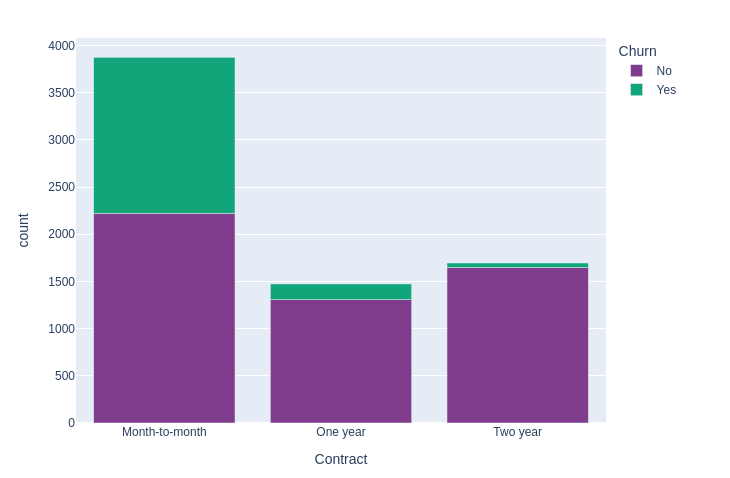
The chart shows how customer churn varies across different contract types. It’s clear that most of the churn comes from users on month-to-month contracts, while those on one-year or two-year plans are more likely to stay. To reduce churn, the company could offer special deals or perks that motivate month-to-month users to upgrade to longer-term commitments.